Where you live could save—or cost—your life
What does a ‘spatial epidemiologist’ do?
PETER: It’s hard to explain what I do, even to my own family. (laughs) My work tries to answer a simple question: how does where we live affect our health outcomes and well-being? Spatial epidemiology, also called geospatial health, is a part of epidemiology that focuses on how location and space affect the spread and causes of diseases and other health issues.
Where did your story begin? How does one become a spatial epidemiologist?
PETER: In secondary school, during a computer studies class, I heard about geographic information systems (GIS) for the first time. GIS is a technology that is used to collect, manage, analyse, and display all types of data with a location component—what is referred to as geospatial data. For example, it can link the location of hospitals to the number of doctors or intensive care unit beds and display these on a map. This concept piqued my interest. So I contacted a university lecturer to ask what this industry looks like and what my career prospects can be. He was very nice and answered all my questions, which helped me decide to pursue this.
So at university, I studied geospatial engineering and GIS. Most of the graduates at the time ended up working as technical engineers, building bridges and roads. But I wanted to remain in academia and research, so I took an opportunity at a research organisation in Kenya which works on health research. Then I completed a postgraduate diploma course in health research methods, and later an MSc in GIS and Remote Sensing, marrying the two fields: spatial and health. I have been modelling and mapping malaria prevalence, spatial accessibility to health facilities, child survival, and similar topics at different institutions, like the KEMRI Wellcome Trust Research Programme, Kenya, and Lancaster University, UK. I finished my PhD in 2020, which focused on mapping child survival in Kenya since the 60s, the disparity in the coverage of child health interventions, and the impact of these interventions on child survival.
When did you join ITM?
PETER: I started in 2023 in Reproductive and Maternal Health Unit led by Professor Lenka Beňová. My current research uses geospatial methods to improve our understanding of the obstacles and barriers that women in urban Africa face when accessing healthcare they need, especially during pregnancy and childbirth -- what I like to call maternal health vulnerability. Since 2023, my team grew to four people working on different elements of geospatial health here at ITM. In 2024 I was awarded a senior postdoctoral fellowship of the FWO, the Research Foundation of Flanders in Belgium.
What role does location or geography play in modern epidemiological studies?
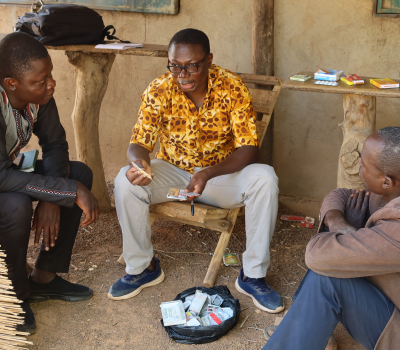
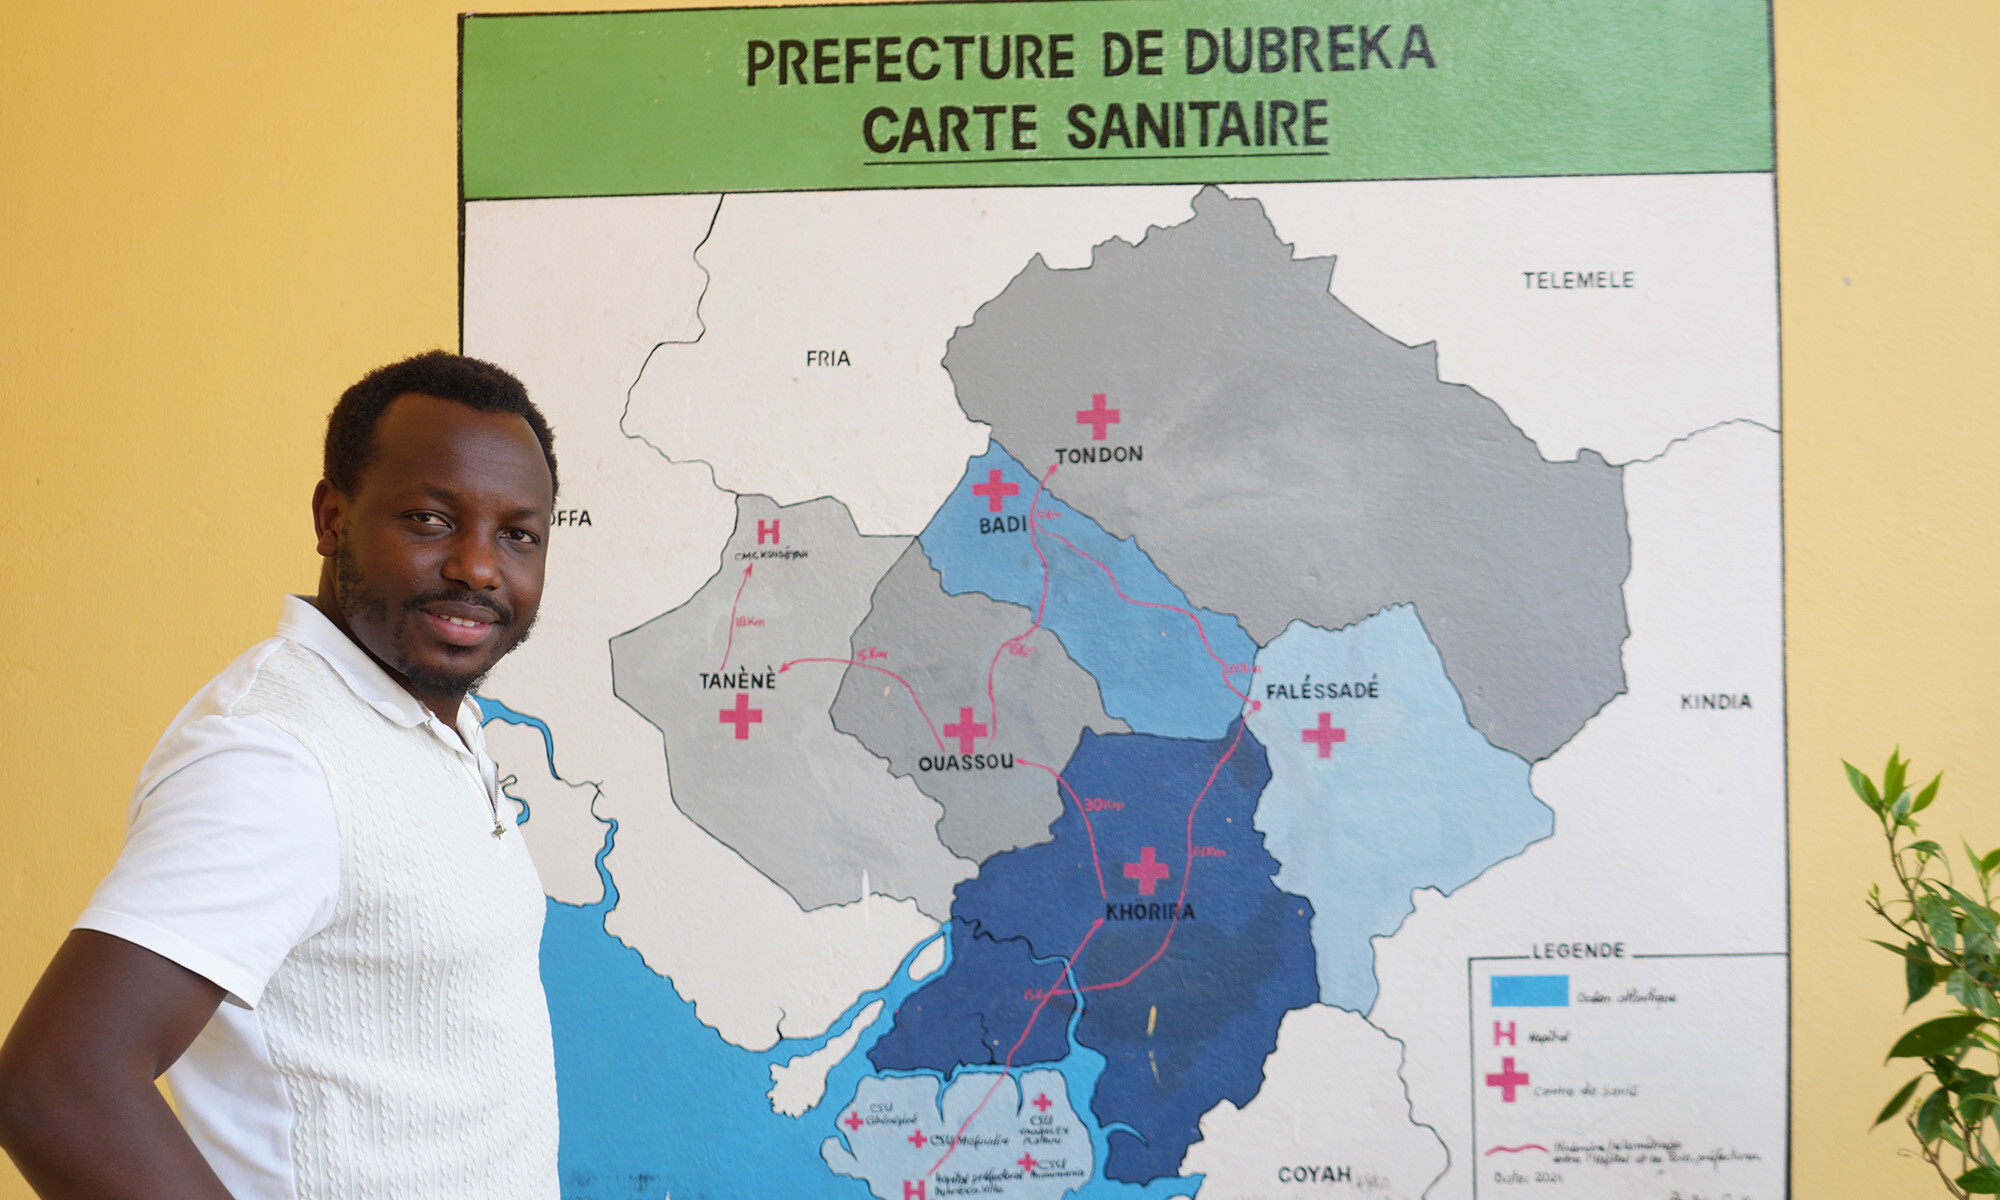
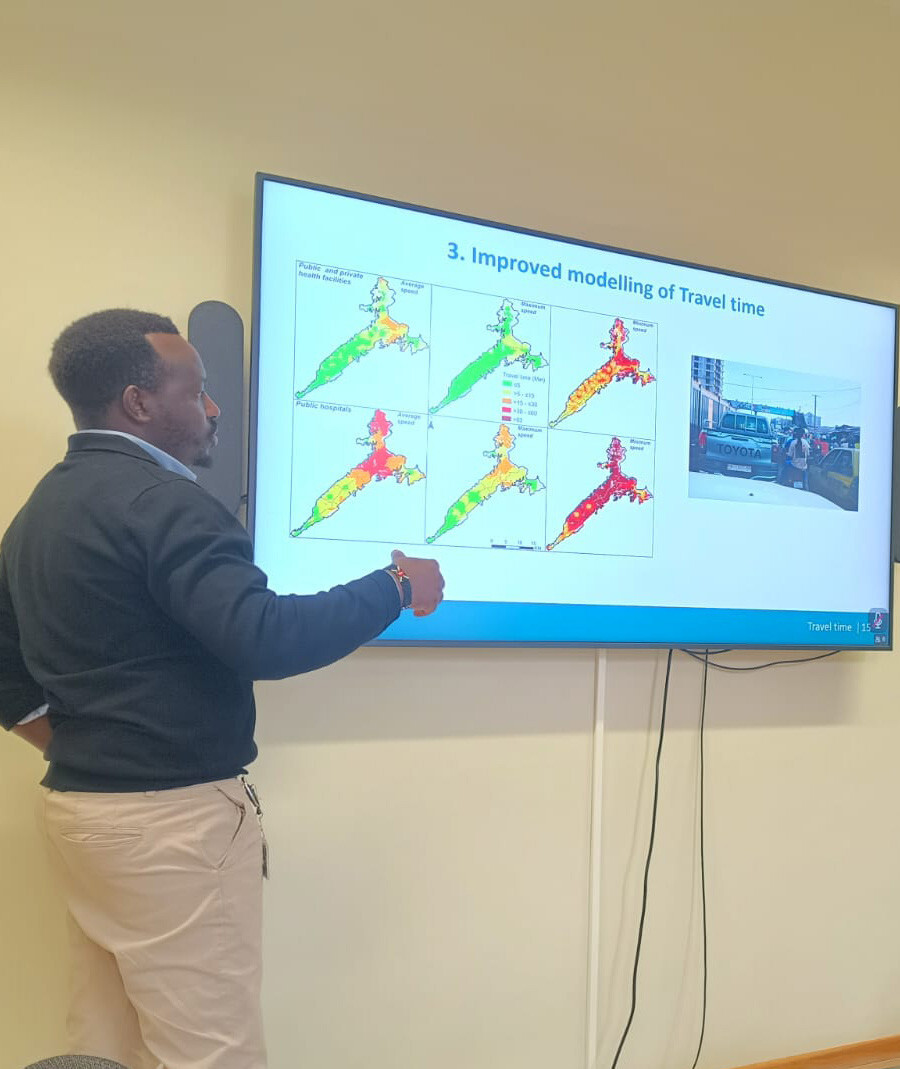
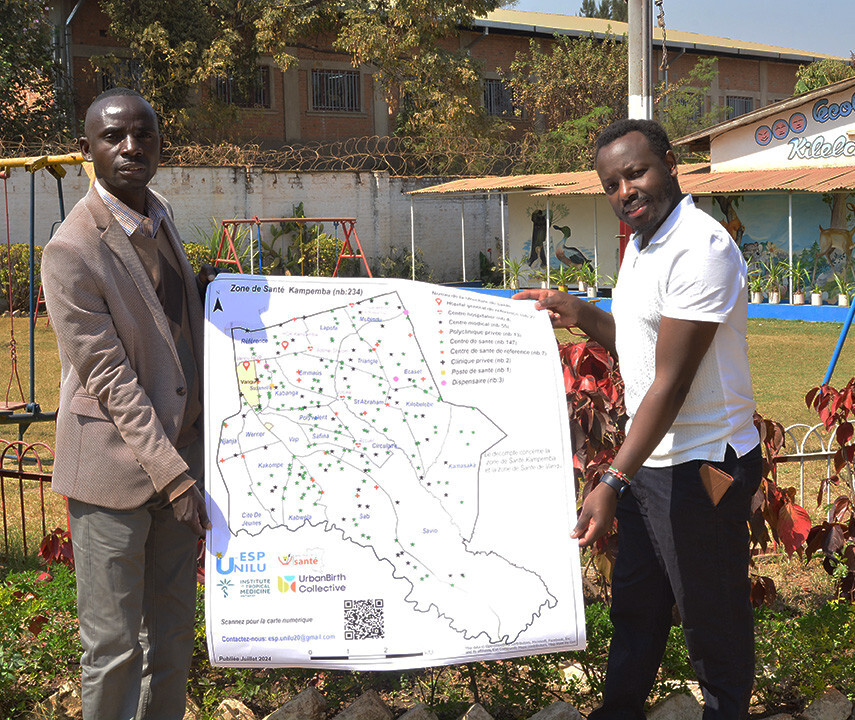
PETER: For example, we recently published an article in Nature Cities about a study we did with our partners in Guinea. The travel time between where people live and their nearest health facility that they can access, is a big challenge in sub-Saharan Africa cities, where traffic jams are a big concern. Many things are associated with this travel time, such as mortality, vaccination, and family planning. We wanted to map the travel time in the capital, Conakry, and the surrounding areas, to the facilities that can offer childbirth services. We found that during heavy traffic, travel times can exceed 2 hours, with likely negative consequences for maternal and perinatal survival and well-being. Two peri-urban communes are near “medical deserts” due to the low number of facilities providing comprehensive emergency obstetric and newborn care. We are now working on similar studies in Cotonou, Benin, and Lubumbashi, DRC, with our local partners. Findings from such studies give an indication to policymakers about expanding and upgrading public and private health facilities and improving infrastructure.
Another example comes from the COVID-19 pandemic in Kenya. We defined 24 indicators to assess what makes people most vulnerable to disease; these indicators included whether hand-washing facilities were available for them, how far they lived from a hospital, and whether they had pre-existing conditions. This way we could analyse which areas and populations are most at risk, and we used our findings in a policy brief to inform planning. We’ve had similar studies for malaria. By mapping malaria prevalence and metrics on using healthcare, we can give indications on which areas to prioritise for vaccine rollout and other interventions.
What type of geospatial data do you use?
PETER: I use a lot of open data sources including households surveys such as Demographic and Health Surveys (DHS), routine data from health facilities, population estimates, and other socio-demographic information. All of these include a specific location, usually based on signals from satellite systems like GPS. This is part of what's called the Global Navigation Satellite System (GNSS), which tells us where something is—for example, the exact location of a hospital. In addition to that, I also use satellite or drone images and other types of data collected from space, known as remote sensing. This tells us what is there—like land cover, temperature, vegetation, or urban structures. Some of these images are free and open source, for others you have to pay if you want high detail. They can be as precise as 1cm on the ground! My work involves seamlessly integrating all these datasets, like stacking floors in a skyscraper, where each floor represents a different layer of information.
The funding for the DHS Program has recently been suspended because of cuts at USAID. How will this affect your work?
PETER: My PhD on child survival in Kenya, for which I heavily relied on this data, would not have been possible without it. This is true for many of my ongoing projects. This data has been collected in a standardised way, and for many low- and middle-income countries, they represent the most comprehensive and reliable source of health data. As we have recently discussed in a paper, discontinuing it can have negative effects not just for research, but also for the lives of millions. I really hope the DHS Program will be restored through alternative pathways.
You are working with big data. The obligatory question is: are you using AI?
PETER: “GeoAI” has become a buzzword in my field and it’s increasingly gaining traction. It refers to the application of artificial intelligence fused with geospatial data, science, and technology. Many people are using it. I also use it to some extent, to decrease manual work and gain extra insights, but I’m cautious with it as it can be a black box inside for some models. We don’t always know how decisions are made in the black box. So for now, I handle it with care.
Spread the word! Share this story on
More stories
-
 - Articles
Erasmus+ mobility: training programme on field approaches of vector control strategies and West Nile virus screening
From 6 to 17 July 2026, Stien Vereecken and Emma Vandenberghe, two ITM scientists from the Unit of Entomology, participated in a specialised training programme at Ecodevelopment in Greece, with the support of an Erasmus+ staff mobility grant.Read more -
- Articles
Wanted: Artist to critically engage with ITM’s colonial heritage
As part of our ongoing reflection on our colonial heritage and institutional history, ITM is launching an artist residency in collaboration with Africalia. We are looking for an artist from the Democratic Republic of the Congo to critically engage with the artworks by Fernand Allard l’Olivier and the broader questions they raise about institutional memory, colonial heritage and the continuing impact of colonialism on the present. Apply for our open call before 20 August.Read more -
- Articles
Community trust should be earned, not assumed
As health actors rush to curb the ongoing outbreak of the Bundibugyo virus in the Democratic Republic of the Congo (DRC), one question risks to remain unanswered: What have we done to earn the trust we assume we will receive from the local communities?Read more -
- Articles
Two new EDCTP grants awarded to ITM
In focus: tuberculosis diagnosis and enhancing expertise in clinical research in sub-Saharan AfricaRead more -
- Articles
From preparedness to practice: bringing evidence closer to reality
With the Fresh Off The Journal series, we bring you our monthly research highlights.Read more -
- Articles
EOS Pipet Award: Isabel Brosius investigated the mpox virus during the outbreak
At the start of a major outbreak of a new mpox variant in the Democratic Republic of the Congo, infectious disease specialist Isabel Brosius (ITM) decided to travel to the region immediately.Read more -
- Articles
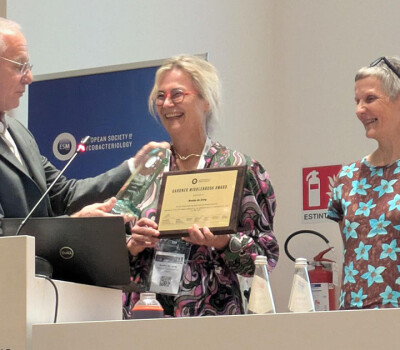
Professor Bouke de Jong receives the 2026 Gardner Middlebrook Award from the European Society of Mycobacteriology
The award celebrates her exceptional career and contributions to the field of mycobacteriology.Read more -
- Articles
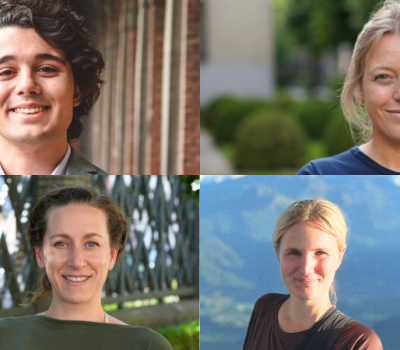
Four ITM researchers awarded postdoctoral fellowships by the Research Foundation of Flanders
The four researchers will carry out vital work on viral spillover, leprosy transmission, mpox, and onchocerciasis-associated epilepsyRead more -
- Articles
How community-based behavioural interventions in rural Burkina Faso and DRC improved antibiotic use
Helping to turn the tide on drug-resistant infectionsRead more -
- Articles
Two Horizon Europe projects awarded to ITM
Researching community health worker-led cardiovascular risk factor management and infectious diseases with epidemic potentialRead more